There are a many ways to analyze stock with Excel. In this post I’ll simply show some of the basics of how I use Excel with stock analysis.
instructions
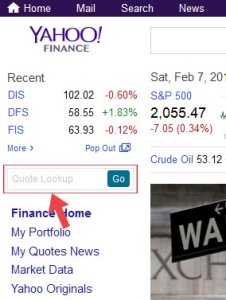
- First go to http://finance.yahoo.com/ and enter the stock symbol into the Quote Lookup box and click the Go button. In this example I’ll be using Disney (DIS).
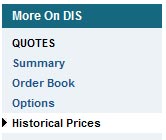
- Once on the DIS summary page. Click the Historical Prices on the left menu.
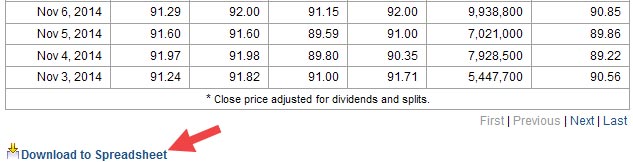
- On the Historical Prices page you’ll see data in a tabular form. Scroll to the bottom and click the Download to Spreadsheet link. This will prompt a download of a CSV file, which is just a universal data file type that can be opened in most spreadsheet applications.
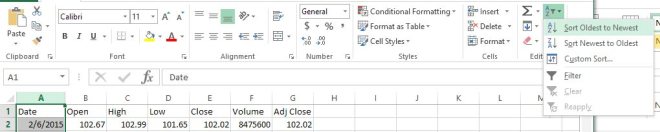
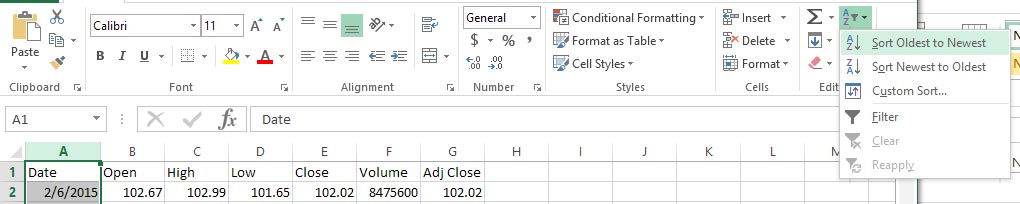
- Once I have it opened in Excel I typically like to sort the first column so that I get the oldest dates first. Do this by clicking the header (A column) at the top so that the whole column is highlighted and then select Sort Oldest to Newest.


So this is the basics. At this point I typically calculate various indicators and triggers for buying and selling so I can back-test my strategy to discover or explore if any of my ideas would have worked in the given periods. Also I should point out that I found it useful to chart some of my calculations using the chart tools in Excel. That was helpful because it gives me a visual perspective of the strategy. Viewing data in various ways can help you creatively explore and modify your strategy. Good luck! I hope this is helpful to you to get you started.
