On Balance Volume (OBV) is considered one of the volume indicators. Admittedly, volume indicators not my specialty. However, for the sake of giving it a try, I went ahead an calculated the OBV indicator. Interestingly enough it is very simple to calculate in Excel.
calculation
c = today's closing price
p = previous day's closing price
v = today's volume

if c > p then,
OBV = OBV previous day + v

else if c < p then,
OBV = OBV previous day - v

otherwise
OBV = OBV previous day
The calculation of the OBV indicator is very much a piecewise function (for the math geeks).
calculating in excel
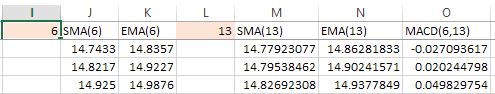
After downloading the spreadsheet you will notice several columns. The highlighted columns are non-calculated columns. In this example I’ll use an RSI(14)
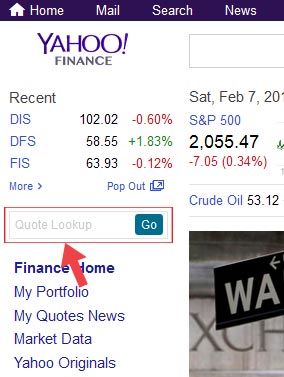
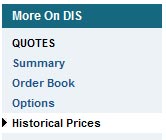
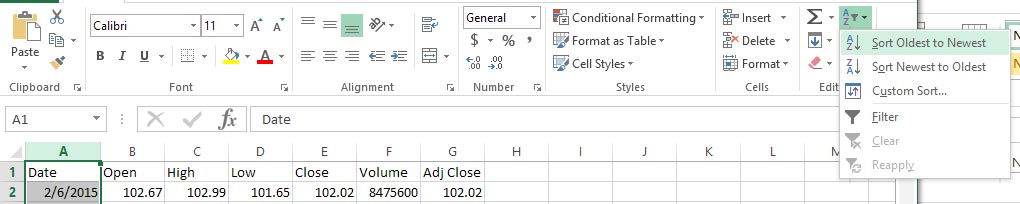
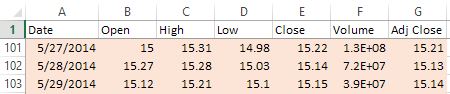
- The first seven columns are data columns. I typically get this information from http://finance.yahoo.com (if you are unsure how to get this information, see this article):
- The next data cell 14 is simply there to indicate how many periods n number of days in our RSI(n) function. You can play around with these numbers to see different calculations. The remaining columns are calculated from the data columns.
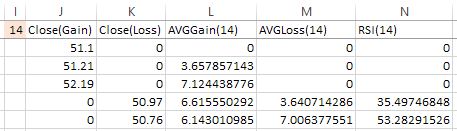
- VERY IMPORTANT: you should know that the first row of calculated values is not calculated. It is set to zeros. This is because the formula relies on a previous value. Since we have no previous value, I set the default to zero. This means the first 20 or so rows are not very accurate.


conclusion
Hopefully this is helpful in your studies. Again, I haven’t been fond of volume indicators. As I have stated before in previous posts, indicators haven’t proven successful for me in my strategies. I would be curious however, if anyone has found success in volume indicators, especially the OBV indicator. Let us know in the comments section if you’ve had any success.