Moving Average Convergence Divergence (MACD) is one of the essential indicators every budding analyst should be familiar with. If I use any indicators in my strategy I usually begin with MACD as a starting point in conjunction. Word of caution, never use any single indicator as the only analytic tool in your strategic repertoire.
calculation
c = closing value of n_day
SMA(n_day) = n_day average of closing values
M(n_day) = (2 / (n + 1))
EMA(n_day) = (c - EMA(previous day)) * M(n_day) + EMA(previous day)

MACD(n, m) = EMA(n_day) - EMA(m_day)
Just a note, whenever I try to learn an indicator, I typically try to look at several sources to get a more complete understanding. This is usually because I have questions beyond what a single source can give.
calculating in excel
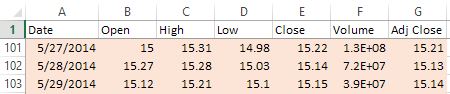
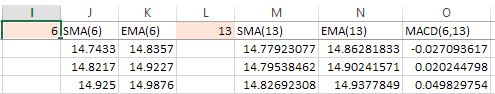
After downloading the spreadsheet you will notice several columns. The highlighted columns are non-calculated columns. In this example I’ll use a MACD(6,13)
- The first seven columns are data columns. I typically get this information from http://finance.yahoo.com (if you are unsure how to get this information, see this article):
- The next two data cells 6 and 13 are simply to indicate how many periods for the n and m parameters in our MACD(n,m) function. You can play around with these numbers to see different calculations. The remaining columns are calculated from the data columns.


conclusion
Hopefully this is helpful in your studies. As I have stated before in a previous post, indicators haven’t proven successful for me in my strategies. They seem helpful at least to give some ballpark indication, but I haven’t seen them work for any consistent reliability in my long term strategies. Contrary to my experience if you’ve had any success let us know in the comments section.
